
This article will explain how to use the (Green) Inventory Report to track your lots and how to export the information from Cropster.
The Green Inventory Report is available for the following products:- Roast (Professional and higher tiers)
- Commerce
- Origin (all tiers)
- Lab
- Why use the (Green) Inventory Report?
- The (Green) Inventory Report overview page
- Exporting the (Green) Inventory Report
Why use the (Green) Inventory Report?
The Green Inventory Report provides you a quick glance and also in-depth information to have a better overview regarding the changes in your Green Inventory.
The data also helps you with accounting, taxes and quality and cost management.
The (Green) Inventory Report overview page
By following the steps below you can open the (Green) Inventory Report overview page:
- Log in to the online platform C-sar.
- Navigate to Reports on the main menu bar.
- Select the Inventory Report.
- You will be directed to the (Green) Inventory Report overview page.

- By scrolling down to the bottom of the page you can select between the following viewpoints the values are displayed by:
The (Green) Inventory Report has two report types:
Snapshot Report
The Snapshot Report is available for all tiers.
The (Green) Inventory Snapshot Report shows your green inventory on a specific day and/or a specific location. 
- Log in to the online platform C-sar.
- Navigate to the Reports on the main menu bar.
- Select Inventory Report.
- Select your preferred Date and/or Locations (1 and 2).
- Select the State (3). You can choose between the following states:
- Raw green
- Parchment
- Dry cherry
- Click on the Apply filters (4) button.
- Scroll down to the bottom of the page and select between the following viewpoints (5):
- By lot
- By location
- By name

Timeframe Report
The Timeframe Report is only available for Professional and higher tiers.
Upon switching from the Timeframe Report view to the Snapshot Report view (or vice versa), the set date range will be reset to the default date.
By default, we set the date range of the Timeframe Report to the last finished month (e.g. if you are in January we would default to the range, 1st of December to 31st of December).
The (Green) Inventory Timeframe Report allows you to view your (Green) Inventory on any given period of time (day, week, month, (half) year, or custom).
The Start date weight is based on the actual Registration Start date of the lot and not the Start date of the Inventory Report.
If the Start date is set earlier than a lot's Registration date, the weight column and value for the Start date will show as zero "0".

- Log in to the online platform C-sar.
- Navigate to the Reports on the main menu bar.
- Select Inventory Report.
- Switch from the Snapshot Report view to the Timeframe Report view by clicking on the respective tab.
- Select a Date range and/or Locations (1 and 2).
- Select the State (3). You can choose between the following states:
- Raw green
- Parchment
- Dry cherry
- Click on the Apply filters (4) button.
- Scroll down to the bottom of the page and select between the following viewpoints (5):
- By lot
- By location
- By name

Sections
The Green Inventory Overview section
- Select the (Green) Inventory Report type .
- Apply the following filters:
- Date or Date Range
- Locations
- State
- The following data will be shown in the next Green Inventory Overview section:
- Weight (kg/lbs)
- Value (USD/EUR)
- Number of locations
- Number of lots
- Number of lots in low stock: The lots that have an inventory level under the lot's specified Minimum inventory level.
- 4 weeks run out: Quantity of lots with 4 weeks run-out prediction.
- 2 weeks run out: Quantity of lots with 2 weeks run-out prediction.

Viewpoints
Scrolling down the (Green) Inventory Report overview page you can select between the following viewpoints:
By lot
The By lot view shows each individual lot in each location as a single line (e.g. If you have a lot allocated among multiple locations, you will see an individual listing for the lot per each location)
- Customize: By clicking on the dropdown next to the Customize button and you can easily refine your report.
💡 You can also include consumed lots for the selected time period:
- Eye icon: It displays the Transaction History of the selected lot.

- Total row: It displays the sums or counts for the visible items on the page. In case of selected rows, the total row only displays results for those selected.
- Show: Changing the total amount of items per page, also affects the amount of items taken into account by the report's total row.
By location
The By location view allows you to take a closer look at the data regarding your locations.
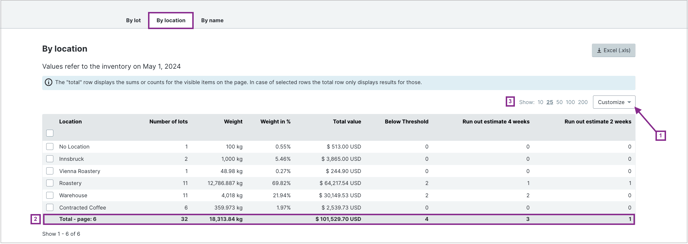
- Customize: By clicking on the dropdown next to the Customize button and you can easily refine your report.

- Total row: It displays the sums or counts for the visible items on the page. In case of selected rows, the total row only displays results for those selected.
- Show: Changing the total amount of items per page, also affects the amount of items taken into account by the report's total row.
By name
The By name view displays the sum weight for all the lots with the same unique ID-tag among all your locations.
💡 In case you operate only one location, the numbers from the By name-view are equal to the By lot-view.
- Customize: By clicking on the dropdown next to the Customize button and you can easily refine your report.
💡 You can also include consumed lots for the selected time period:
- Total row: It displays the sums or counts for the visible items on the page. In case of selected rows, the total row only displays results for those selected.
- Show: Changing the total amount of items per page, also affects the amount of items taken into account by the report's total row.
In the By name view, the run out estimation shows the summed run out estimation of all the lots with this name, across all locations.
For example, if there is one lot that has a run out estimation of 2 weeks and another lot with the same name that has a run out estimation of 4 weeks, the run out estimation in the By name tab would show 6 weeks. This calculation does not include any green inventory that has not yet been roasted.
Exporting the (Green) Inventory Report
By following the steps below you can export your (Green) Inventory Report to Excel:
- Once you have selected your preferred viewpoint and the amount of items on the page you are ready to export your report to Excel by clicking on the
 button.
- A window will pop up where you can select which fields (columns) you want to include in the Excel report by clicking on the respective checkboxes:
💡 The fields (columns) differ according to your selected viewpoint. The By lot viewpoint is displayed on the following screenshot:
- Click on Export to Excel.
Related content
Congratulations! You are now ready to use the (Green) Inventory Report.
Your opinion matters. If you have further questions, feedback, or concerns, please feel free to reach out by submitting a support ticket directly from support.cropster.com.