
This article explains how to use Cafe Radar in Cropster Cafe.
- What is Cafe Radar?
- Selecting a Date Range and Filter for Espresso Machines
- Types of KPI Cards and their functions
- Adding new KPI Cards
- Editing KPI Cards
What is Cafe Radar?
Cafe Radar is a customizable dashboard designed to monitor and analyze the quality of production and performance of espresso machines across various locations.
It consolidates data from any connected espresso machine into Key Performance Indicators (KPIs), providing users with valuable insights into their operations.
By following the steps below, you can navigate to Cafe Radar:
- Log in to the online platform C-sar
- Navigate to Cafe on the main menu bar.
- Select Radar. You will be directed to the Cafe Radar page.

Selecting a Date Range and Filter for Espresso Machines
Cafe Radar offers the following functionalities:
- Selecting a Date Range:

- Selecting Machines to filter the Dashboard for:
💡 By selecting the option to "Save filters as default," you can ensure that your chosen filters are preserved for future sessions.
Only the machines that have recorded brews during the specified Date range will be displayed on the Radar.
Users can save their Dashboard filter selections, including the chosen Date range and specific machines.
This customization, along with the layout of Key Performance Indicators (KPIs), is automatically stored for each user. As a result, when users return to the dashboard, their personalized view will be displayed instead of the default layout.
Types of KPI Cards and their functions
Cafe Radar offers five distinct types of KPI Cards, each designed to provide specific insights into espresso machine performance and production metrics.
- Brew activity
- Brews in/out of range
- Change of brews in/out of range
- Number of brews (daily average)
- Change in number of brews
| Type | Details |
| Brew activity | Brew activity indicates the count of machines that have not recorded any brews within the last X hours, calculated from the conclusion of the selected timeframe. This KPI is following the selected timeframe, so it’s not a ‘current’ view unless the timeframe is ‘Today’. The badge does show ‘currently online’. |
|
Brews in/out of range |
You have the flexibility to choose from two distinct options to display on this specific KPI Card:
|
|
Change in brews in/out of range |
You have the flexibility to choose from two distinct options to display on this specific KPI Card:
|
| Brew production | You have the flexibility to choose from four distinct options to display on this specific KPI Card:
|
| Change in brew production | You have the flexibility to choose from four distinct options to display on this specific KPI Card:
|
Adding new KPI Cards
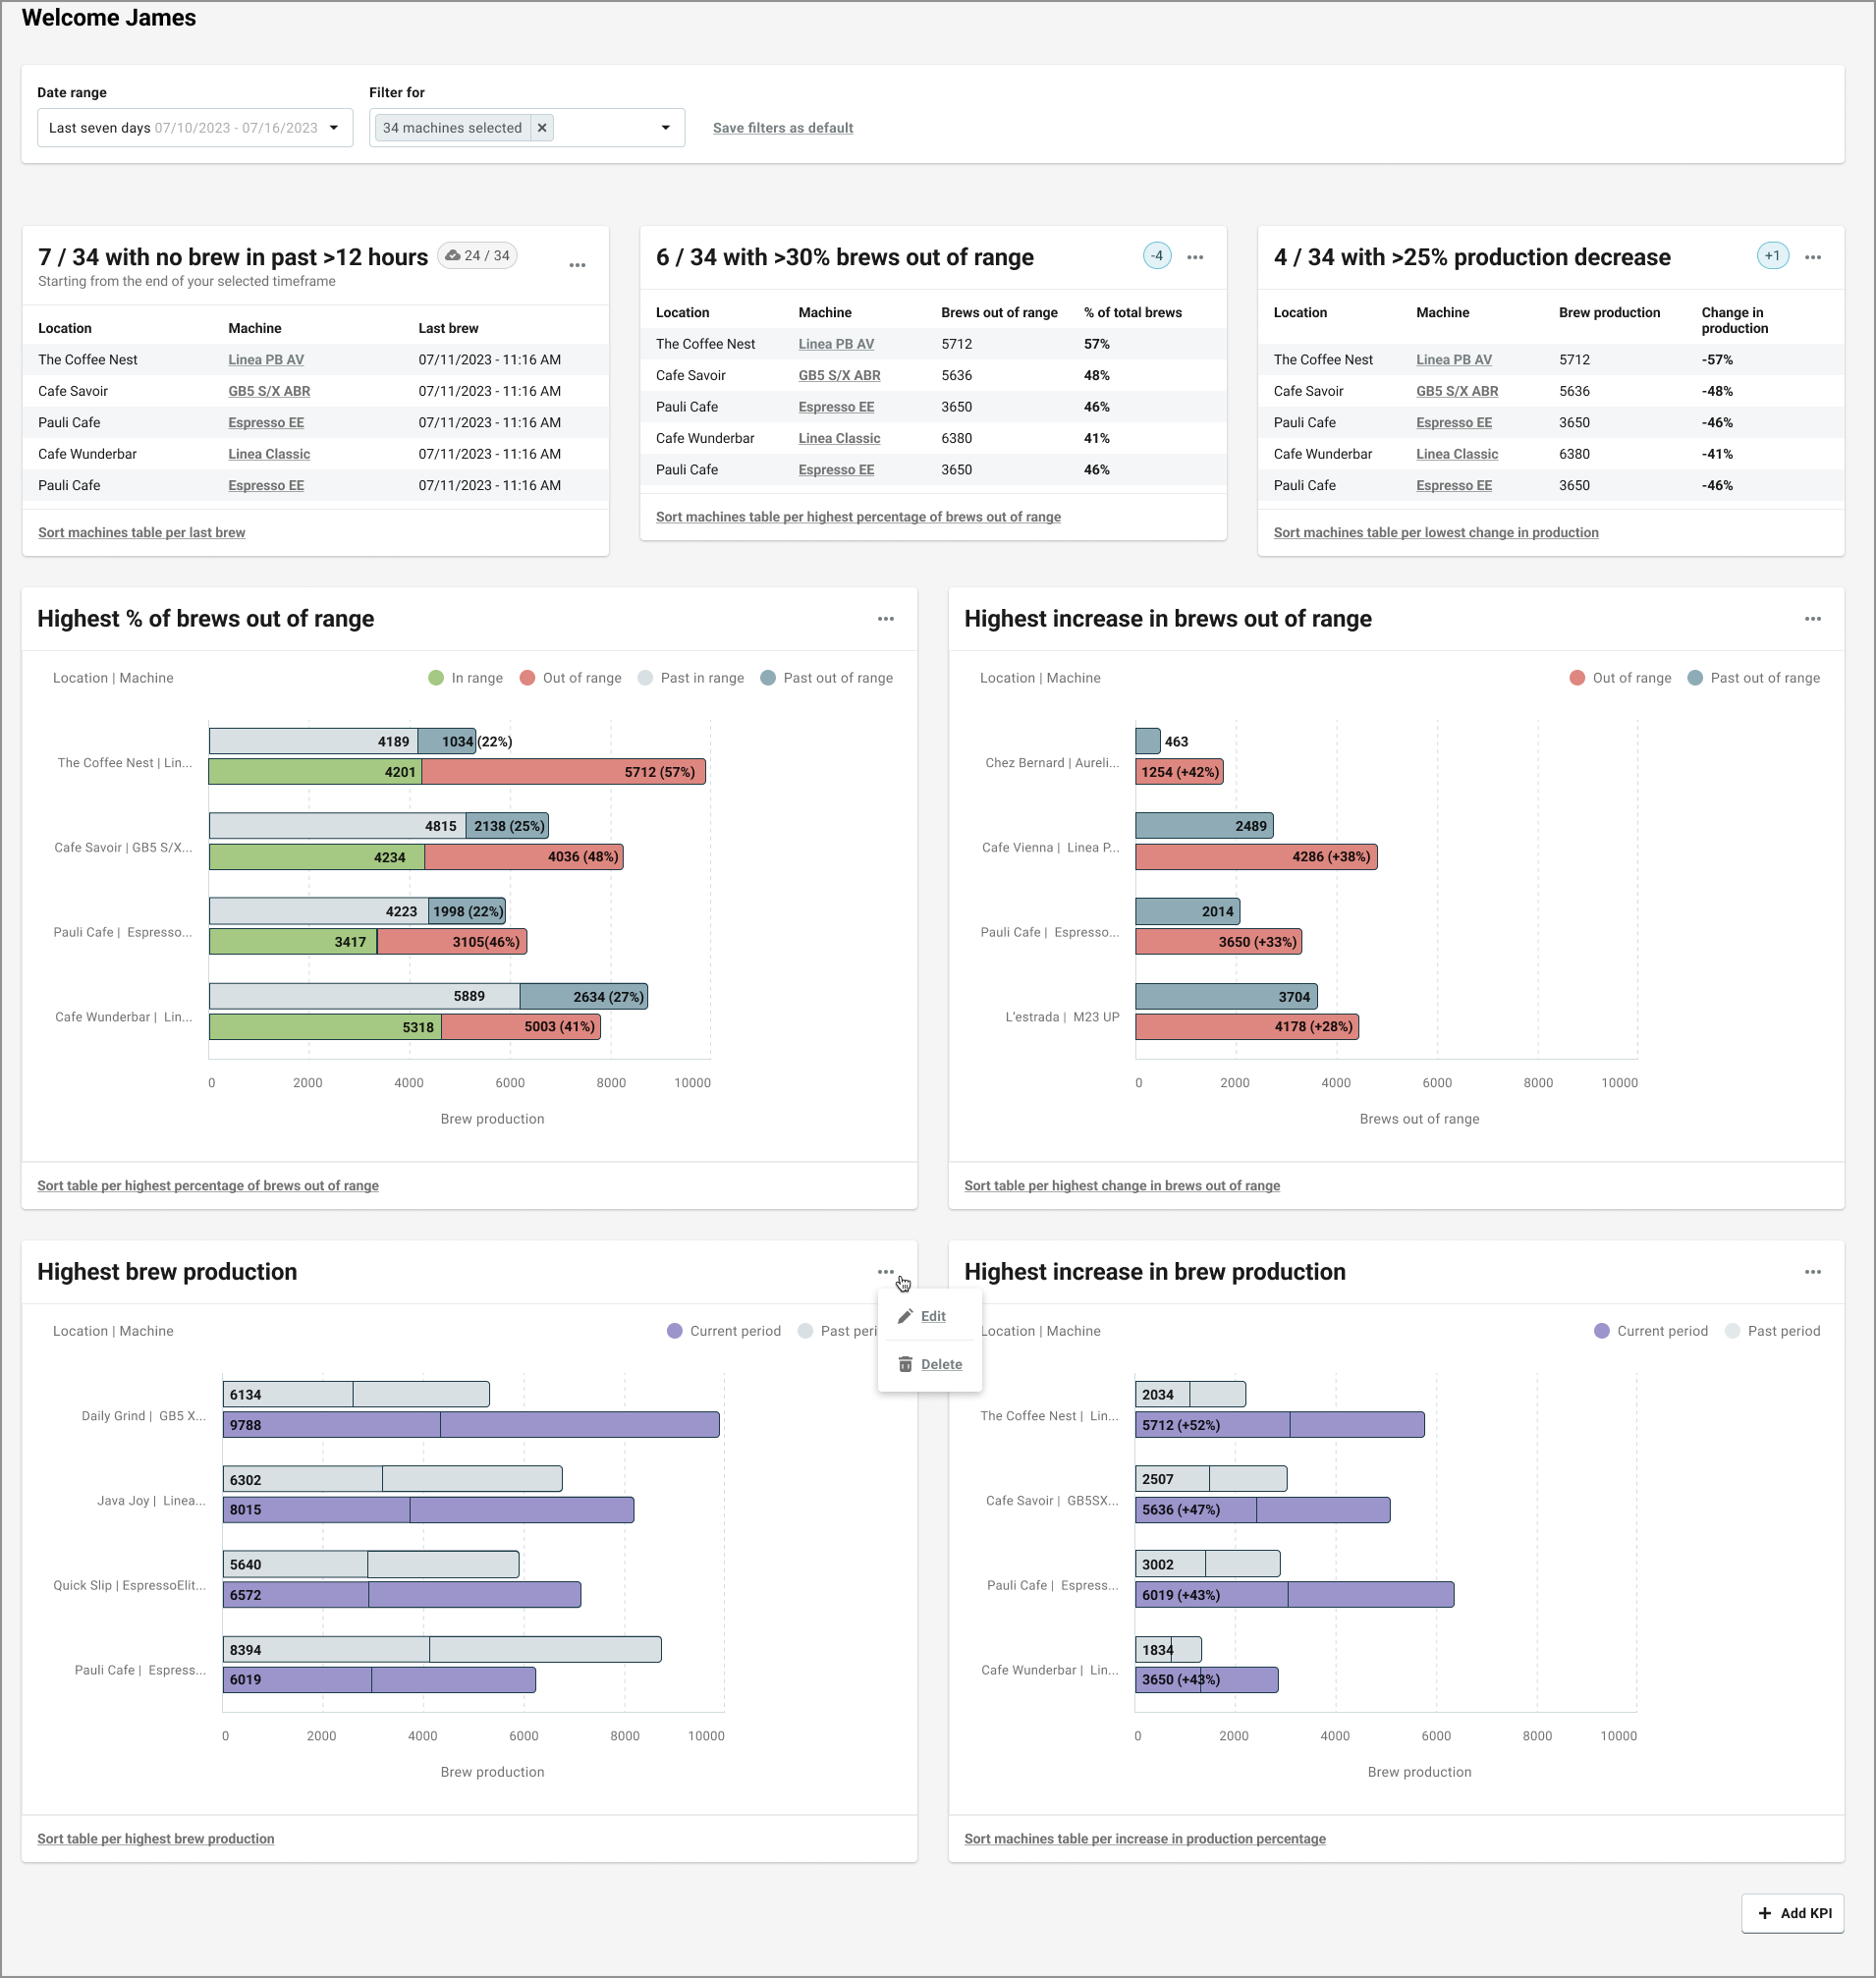
The initial setup of Cafe Radar for every user features a set of predefined KPI cards, which provide essential insights at a glance:
- Machines with no brews in the past >12 hours, as a table
- Machines with >30% brews out of range, as the table
- Machines with >25% production decrease, as a table
- Machines with the highest % of brews out of range, as a chart
- Machines with the highest increase in brews out of range, as a chart
- Machines with the highest brew production, as a chart
- Machines with the highest increase in brew production, as a chart
By following the steps below, you can easily add new KPI Cards:
- Complete steps 1-4 written above.
- Scroll down to the bottom of the page.
- Click +Add KPI on the bottom right side of the page.

- A customizable KPI card will appear.

- Select the following details:
-
- .Show the most affected machines as:
- Table
- Chart
- .Show the most affected machines as:
- Click Submit to save the new KPI Card.
Editing KPI Cards
By following the steps below, you can easily edit your KPI Cards:
- Complete steps 1-4 written above.
- Locate the KPI Card you wish to edit.
- Select the "..." (three dots) located in the upper right corner of the KPI Card.
- Click on the
-png.png?width=16&height=16&name=EditIcon%20(1)-png.png) Edit icon.
Edit icon.
- You can edit the following details:
- KPI Card type
- Show machines with.
- Show the most affected machines as:
- Table
- Chart
- Click Submit to finalize the changes.
You can also delete your KPI Cards by selecting the ![]() Delete icon.
Delete icon.
The Machines Overview Table
At the bottom of the Cafe Radar, you will find a comprehensive, sortable table displaying all espresso machines, which includes the following key information:
- Status (online/offline)
- Location
- Model
- Last brew
- Brew production
- Change in production
- Brews out of range %
- Change in brews out of range
- Brews in range %
- Change in brews in range
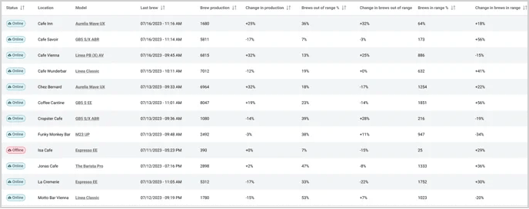
You can sort the table by any Key Performance Indicator (KPI) by clicking the "sort table per..." button located at the bottom of each KPI card.
Additionally, you can click the arrows next to each KPI in the table to display the machines with either the highest or lowest values for that specific KPI. By default, the table is sorted by 'Last brew'.
Congratulations! You have successfully learned how to use Cafe Radar.
Your opinion matters. If you have further questions, feedback, or concerns, please feel free to reach out by submitting a support ticket directly from support.cropster.com.